UK Yellow Page
Your Essential Digital Toolkit in the United Kingdom
Your Essential Digital Toolkit in the United Kingdom
去英國 Costco 買嘢,最掃興莫過於專程揸車去到,結果發現心水貨品(例如超搶手的蝦餃、特價點心)已經被人掃清光!為了幫大家節省時間同油錢,Costxx 查貨助手 推出了一個非常強大的功能 —— 庫存走勢圖 (Heatmap)。
只要學識睇這個圖表,您就可以透過過往網友的報料數據,摸索出該貨品的「補貨規律」!今日就教大家點樣運用這個功能。
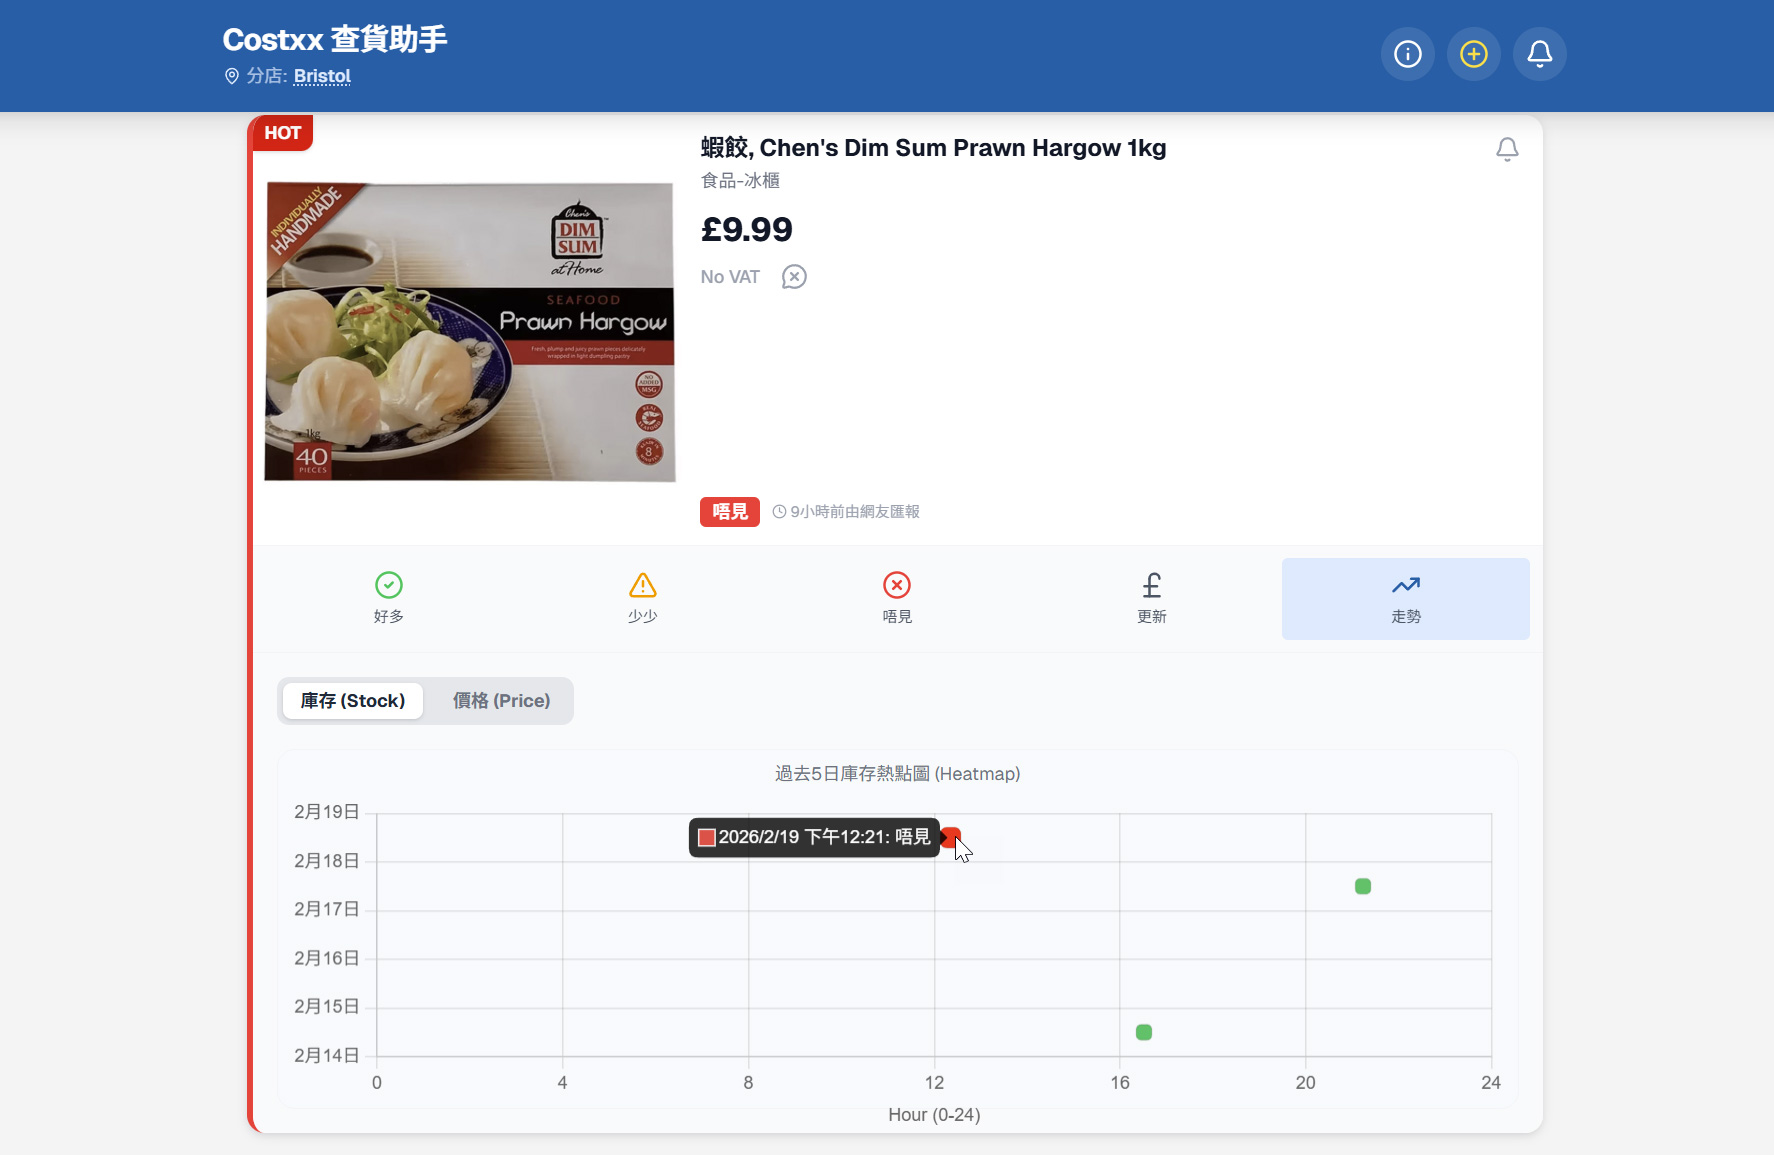
當您在查貨助手找到心水貨品後,除了可以見到即時的「好多」、「少少」、「唔見」狀態外,最右邊會有一個藍色的 「走勢」按鈕(帶有折線圖標籤)。
按下去之後,下方就會展開一個名為 「過去 5 日庫存熱點圖 (Heatmap)」 的圖表。
這個熱點圖的設計非常直覺,主要由兩個軸組成:
圖表上的每一粒「點」都代表了一次網友的真實報料。顏色的深淺和不同代表了當時的庫存狀態:
如果您想知道更精確的情報,可以直接點擊(或游標懸停)圖表上的任何一粒點。系統會彈出一個小黑框,顯示具體的報料時間和狀態。例如:
「2026/2/19 下午 12:21:唔見」
這代表在 19 號中午時分,該貨品已經售罄。如果您計畫下午才去,見到這個紅色信號,可能就要三思,或者考慮去另一間分店了。
透過這個庫存熱點圖,您可以分析出不同分店的分水貨品有冇貨,以免去到得個吉。
這個功能有賴大家的無私分享,下次去 Costco 見到熱門貨品,記得打開 Costxx 查貨助手 順手篤幾下報料,建立更強大的互助數據庫!
如果你覺得這個新功能好用,
歡迎請開發者飲杯咖啡支持下!☕

When shopping at Costco in the UK, nothing is more disappointing than driving all the way there only to find your favorite items (like the highly sought-after prawn dumplings or discounted dim sum) have been completely wiped out! To help everyone save time and fuel, the Costxx Stock Tracker has introduced a very powerful feature — the Stock Heatmap.
Once you learn how to read this chart, you can figure out the "restock patterns" of these items through past data reported by other users! Today, we'll teach you exactly how to use this feature.
When you find your desired item on the Stock Tracker, besides seeing the real-time "Plenty" (好多), "Few" (少少), or "None" (唔見) statuses, there is a blue "Trend" (走勢) button (with a line chart icon) on the far right.
Once you click it, a chart called the "Past 5 Days Stock Heatmap" will expand below.
The design of this heatmap is very intuitive, primarily consisting of two axes:
Every "dot" on the chart represents a real report submitted by a user. The different colors represent the stock status at that specific time:
If you want more precise intelligence, you can directly click (or hover over) any dot on the chart. The system will pop up a small black box showing the exact report time and status. For example:
"2026/2/19 12:21 PM: None (唔見)"
This means by noon on the 19th, the item was already sold out. If you were planning to go in the afternoon and see this red signal, you might want to reconsider or check the stock at another branch.
Through this stock heatmap, you can analyze whether your favorite items are in stock at different branches, helping you avoid a wasted trip.
This feature relies on everyone's selfless sharing. Next time you see a popular item at Costco, remember to open the Costxx Stock Tracker and tap to report it, helping us build a stronger, mutually beneficial database for the community!
If you find this real-life experience useful or
if the tools help your life in the UK,
feel free to buy the editor a coffee! ☕
© 2026 UK Yellow Page. All rights reserved.
Disclaimer: The tools on this website are independently developed for personal assistance. We are not officially affiliated, authorized, or associated with any companies mentioned.
免責聲明: 本網站的工具為獨立開發之個人輔助工具。我們與任何公司無任何官方關聯、授權或合作關係。